


Tracking a single subject's journey through a clinical trial requires pulling data from endless sources. To get a complete picture, teams rely on Patient Profiles.
This article is for: Data Managers, Clinical Research Associates (CRAs), Medical Writers, and Pharmacovigilance teams looking to automate their data review workflows. We will show you how leveraging an AI Regulatory and Medical Authoring solution can drastically cut the time spent on manual data aggregation.
Key Takeaways
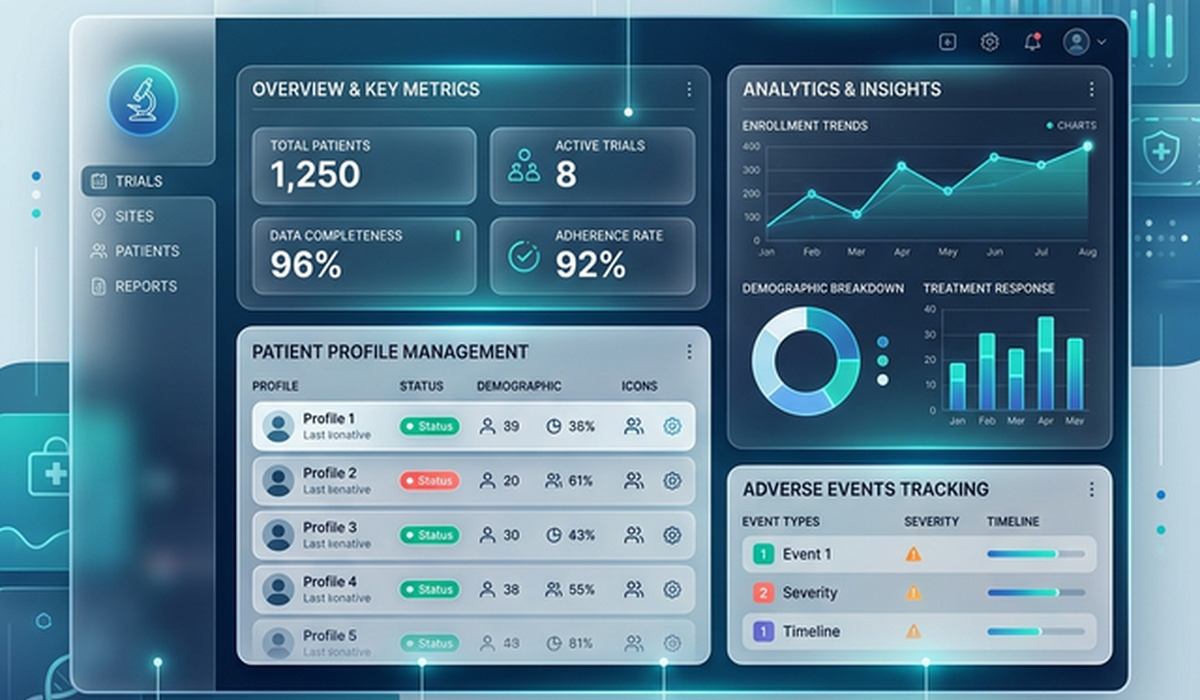
Holistic View: Patient Profiles aggregate data from EDC and other sources into an easy-to-read dashboard, eliminating fragmented reviews.
Faster Narratives: Automated profiles directly feed the drafting of Patient Safety Narratives, saving writers roughly 60% of their initial authoring time.
Improved Monitoring: CRAs and Pharmacovigilance teams can drill down into specific adverse events faster, allowing for real-time safety interventions.
The Problem with Manual Data Review
A patient profile is simply a listing of data gathered on one subject during a trial. It answers crucial questions: Why did this patient take a concomitant medication? What were the lab results leading up to an adverse event?
Historically, building these profiles meant downloading massive spreadsheets from Electronic Data Capture (EDC) systems and manually filtering them. When safety reviewers need to verify dosing records against adverse events, they end up jumping between five different tabs.
This manual process causes three major problems:
Time Sync: Medical writers spend an average of 3-4 hours per patient just gathering the data required to draft Patient Safety Narratives.
Data Blindspots: When data is scattered, Pharmacovigilance teams risk missing early safety signals.
Reporting Delays: Drafting PV Periodic Reports (DSUR, PSUR, PBRER, PADER) gets bottlenecked because the underlying patient data is locked in unformatted tables.
How AuroraPrime Automates Patient Profiles
AuroraPrime Collect directly integrates with our Patient Profiles module to fix this. Instead of a series of spreadsheets, you get a highly visual, configurable dashboard.
1. Synchronized EDC Data
The platform retrieves subject CRF data straight from the EDC system. You don't have to export or format anything. The system maps specific data points—like lab results, vital signs, and tumor assessments—directly into predefined metrics. If a CRA enters a new adverse event today, the safety team sees it on the dashboard almost immediately.
2. Componentized Dashboards
Different teams need to see different things. AuroraPrime allows you to build componentized dashboards.
You simply drag and drop the metrics you care about:
Demographics
Adverse Events
Concomitant Medications
Tumor Assessments (Crucial for oncology trials to track efficacy against tumor size).
If a Medical Writer is drafting narratives, they can configure the dashboard to highlight exactly the timeline they need.
3. The Power of the Visit Date Metric
The core of a good profile is chronological awareness. AuroraPrime enforces a mandatory "Visit Date" metric. This anchors all graphical representations of the data to an X-axis timeline.
If you are trying to figure out if a spike in a qualitative lab result happened before or after a new trial drug dose, the timeline view makes it obvious in seconds. You stop guessing and start analyzing.
Downstream Impact on Authoring and Safety
When you automate the creation of these profiles, the benefits cascade down your entire operational pipeline.
Accelerating Patient Safety Narratives
Medical Writers rely heavily on these profiles to write narratives for agency submissions. By feeding structured, clean data from the profiles into our AI Regulatory and Medical Authoring engine, writers can generate a solid first draft instantly.
Streamlining Pharmacovigilance
For safety teams, time is critical. When compiling massive PV Periodic Reports (DSUR, PSUR, PBRER, PADER), Pharmacovigilance teams need quick access to patient-level data to minimize risk. A dashboard view allows them to spot trends across cohorts rather than getting lost in the weeds of a single CRF page.
Frequently Asked Questions
What exact data goes into a patient profile?
It typically includes demographics, medical history, quantitative and qualitative lab results, vital signs, trial drug dosing, concomitant medications, and adverse events. The specific mix depends on your dashboard configuration.
How does this integrate with PV Periodic Reports?
The structured data in the patient profiles is easily exported or referenced when drafting large periodic safety reports, reducing the time spent tracking down primary source data.
Can different roles see different profile views?
Yes. The dashboards are configurable, so a Data Manager can focus on data quality metrics, while a Pharmacovigilance lead can focus strictly on safety events.
Conclusion
Automating Patient Profiles is the fastest way to unblock your clinical and regulatory teams. By moving away from manual spreadsheets and adopting integrated, visual dashboards, you give your teams the exact context they need, exactly when they need it.
Stop wasting hours hunting for data across EDC pages. Give your Medical Writers and CRAs the tools they need to focus on what matters: patient safety and
